Another way a systems analyst can show the scope of the system and define proper system boundaries is to use an entity-relationship model. The elements that make up an organizational system can be referred to as entities. An entity may be a person, a place, or a thing, such as a passenger on an airline, a destination, or a plane. Alternatively, an entity may be an event, such as the end of the month, a sales period, or a machine breakdown. A relationship is the association that describes the interaction among the entities.
There are many different conventions for drawing entity-relationship (E-R) diagrams (with names like crow’s foot, Arrow, or Bachman notation). In this tutorial, we use crow’s foot notation. For now, we assume that an entity is a plain rectangular box.
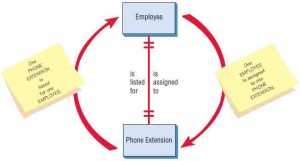
Figure 1 below shows a simple entity-relationship diagram. Two entities are linked together by a line. In this example, the end of the line is marked with two short parallel marks (| |), signifying that this relationship is one-to-one. Thus, exactly one employee is assigned to one phone extension. No one shares the same phone extension in this office.
The red arrows are not part of the entity-relationship diagram. They are present to demonstrate how to read the entity-relationship diagram. The phrase on the right side of the line is read from top to bottom as follows: “One EMPLOYEE is assigned to one PHONE EXTENSION.” On the left side, as you read from bottom to top, the arrow says, “One PHONE EXTENSION is listed for one EMPLOYEE.”

Figure 1 – An entity-relationship diagram showing a many-to-one relationship.
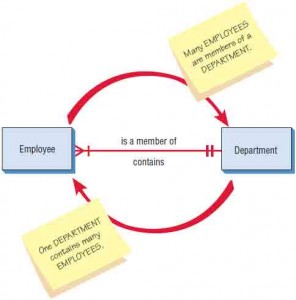
Similarly, Figure 2 below shows another relationship. The crow’s foot notation ( ![]() ) is obvious on this diagram, and this particular example is a many-to-one example. As you read from left to right, the arrow signifies, “Many EMPLOYEES are members of a DEPARTMENT.” As you read from right to left, it implies, “One DEPARTMENT contains many EMPLOYEES.”
) is obvious on this diagram, and this particular example is a many-to-one example. As you read from left to right, the arrow signifies, “Many EMPLOYEES are members of a DEPARTMENT.” As you read from right to left, it implies, “One DEPARTMENT contains many EMPLOYEES.”
Figure 2 – Examples of different types of relationships in E-R diagrams.
Notice that when a many-to-one relationship is present, the grammar changes from “is” to “are” even though the singular “is” is written on the line. The crow’s foot and the single mark do not literally mean that this end of the relationship must be a mandatory “many.” Instead, they imply that this end could be anything from one to many.
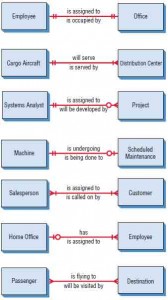
Figure 3 below elaborates on this scheme. Here we have listed a number of typical entity relationships. The first, “An EMPLOYEE is assigned to an OFFICE,” is a one-to-one relationship. The second one is a one-to-many relationship: “One CARGO AIRCRAFT will serve one or more DISTRIBUTION CENTERs.” The third one is slightly different because it has a circle at one end. It can be read as “A SYSTEMS ANALYST may be assigned to MANY PROJECTS,” meaning that the analyst can be assigned to no projects [that is what the circle (O), for zero, is for], one, or many projects. Likewise, the circle (O) indicates that none is possible in the next relationship. Recall that the short mark means one. Therefore, we can read it as follows: “A MACHINE may or may not be undergoing SCHEDULED MAINTENANCE.” Notice that the line is written as “is undergoing,” but the end marks on the line indicate that either no maintenance (O) or maintenance (I) is actually going on.

Figure 3 – Examples of different types of relationships in E-R diagrams.
The next relationship states, “One or many SALESPEOPLE (plural of SALESPERSON) are assigned to one or more CUSTOMERs.” It is the classic many-to-many relationship. The next relationship can be read as follows: “The HOME OFFICE can have one or many EMPLOYEEs,” or “One or more EMPLOYEEs may or may not be assigned to the HOME OFFICE.” Once again, the I and O together imply a Boolean situation; in other words, one or zero.
The final relationship shown here can be read as, “Many PASSENGERs are flying to many DESTINATIONs.” This symbol [ ![]() ] is preferred by some to indicate a mandatory “many” condition. (Would it ever be possible to have only one passenger or only one destination?) Even so, some CASE tools such as Visible Analyst do not offer this possibility, because the optional one-or-many condition as shown in the SALESPERSON-CUSTOMER relationship will do.
] is preferred by some to indicate a mandatory “many” condition. (Would it ever be possible to have only one passenger or only one destination?) Even so, some CASE tools such as Visible Analyst do not offer this possibility, because the optional one-or-many condition as shown in the SALESPERSON-CUSTOMER relationship will do.
Up to now we have modeled all our relationships using just one simple rectangle and a line. This method works well when we are examining the relationships of real things such as real people, laces, and things. Sometimes, though, we create new items in the process of developing an information system. Some examples are invoices, receipts, files, and databases. When we want to describe how a person relates to a receipt, for example, it becomes convenient to indicate the receipt in a different way, as shown in the table below as an associative entity.
Three different types of entities used in E-R diagrams.
 | Usually a real entity: a person, place, or thing |
 | Something created that joins two entities |
 | Something useful in describing attributes, especially repeating groups |
An associative entity can only exist if it is connected to at least two other entities. For that reason, some call it a gerund, a junction, an intersection, or a concatenated entity. This wording makes sense because a receipt wouldn’t be necessary unless there were a customer and a salesperson making the transaction.
Another type of entity is the attributive. When an analyst wants to show data that are completely dependent on the existence of a fundamental entity, an attributive entity should be used.
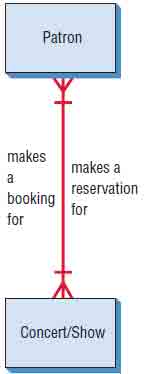
For example, when a library had multiple copies of the same book, an attributive entity could be used to designate which copy of the book is being checked out. The attributive entity is useful for showing repeating groups of data. For example, suppose we are going to model the relationships that exist when a patron gets tickets to a concert or show. The entities seem obvious at first: “a PATRON and a CONCERT/SHOW,” as shown in Figure 4. What sort of relationship exists? At first glance the PATRON gets a reservation for a CONCERT/SHOW, and the CONCERT/SHOW can be said to have made a booking for a PATRON.

Figure 4 – The first attempt at drawing an E-R diagram.
The process isn’t that simple, of course, and the E-R diagram need not be that simple either. The PATRON actually makes a RESERVATION, as shown in Figure 5. The RESERVATION is for a CONCERT/SHOW. The CONCERT/SHOW holds the RESERVATION, and the RESERVATION is in the name of the PATRON. We added an associative entity here because a RESERVATION was created due to the information system required to relate the PATRON and the CONCERT/SHOW.

Figure 5 – Improving the E-R diagram by adding an associative entry called RESERVATION
Again this process is quite simple, but because concerts and shows have many performances, the E-R diagram is drawn once more in Figure 6. Here we add an attributive entity to handle the many performances of the CONCERT/SHOW. In this case the RESERVATION is made for a particular PERFORMANCE, and the PERFORMANCE is one of many that belong to a specific CONCERT/SHOW. In turn the CONCERT/SHOW has many performances, and one PERFORMANCE has a RESERVATION that is in the name of a particular PATRON.

Figure 6 – A more complete E-R diagram showing data attributes of the entities.
To the right of this E-R diagram is a set of data attributes that make up each of the entities. Some entities may have attributes in common. The attributes that are underlined can be searched for. The attributes are referred to as keys and are discussed in Chapter 13.
E-R diagrams are often used by systems designers to help model the file or database. It is even more important, however, that the systems analyst understand early both the entities and relationships in the organizational system. In sketching out some basic E-R diagrams, the analyst needs to:
- List the entities in the organization to gain a better understanding of the organization.
- Choose key entities to narrow the scope of the problem to a manageable and meaningful dimension.
- Identify what the primary entity should be.
- Confirm the results of steps 1 through 3 through other data-gathering methods (investigation, interviewing, administering questionnaires, observation, and prototyping), as discussed in Chapters 4 through 6.
It is critical that the systems analyst begin to draw E-R diagrams upon entering the organization rather than waiting until the database needs to be designed, because E-R diagrams help the analyst understand what business the organization is actually in, determine the size and scope of the problem, and discern whether the right problem is being addressed. The E-R diagrams need to be confirmed or revised as the data-gathering process takes place.
Contents
- Organizations as Systems
- Virtual Organizations and Virtual Teams
- Taking a Systems Perspective
- Enterprise Systems: Viewing the Organization as a System
- Systems and the Context-Level Data Flow Diagram
- Systems and the Entity-Relationship Model
- Use Case Modeling / Use Case Symbols
- Use Case Relationships
- Developing Use Case Diagrams & Use Case Scenarios
- Use Case Levels (Use case Modeling)
- Levels of Management
- Organizational Culture

