There are several steps you must take in sequential order to assure that the database will be useful for presenting data.
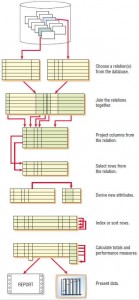
Steps in Retrieving and Presenting Data There are eight steps in the retrieval and presentation of data:
- Choose a relation from the database.
- Join the relations together.
- Project columns from the relation.
- Select rows from the relation.
- Derive new attributes.
- Index or sort rows.
- Calculate totals and performance measures.
- Present data.
The first and last steps must be done, but the six steps in between are optional, depending on how data are to be used. Figure illustrated below is a visual guide to the steps.

The final step in the retrieval of data is presentation. Presentation of the data abstracted from the database can take many forms. Sometimes the data will be presented in tabular form, sometimes in graphs, and other times as a single-word answer on a screen. Output design, as covered in Chapter “Designing Effective Output“, provides a more detailed look at presentation objectives, forms, and methods.
Denormalization
One of the main reasons for normalization is to organize data so as to reduce redundant data. If you are not required to store the same data over and over again, you can save a great deal of space. Such organization allows the analyst to reduce the amount of storage needed, something that was very important when storage was expensive.
We learned in the last section that to use normalized data we had to progress through a series of steps that involved joining, sorting, and summarizing. When speed of querying the database (that is, asking a question and requiring a rapid response) is critical, it may be important to store data in other ways.
Denormalization is the process of taking the logical data model and transforming it into a physical model that is efficient for the most often needed tasks. These tasks can include report generation, but they can also mean more efficient queries. Complex queries such as online analytic processing (OLAP), as well as data mining and knowledge data discovery (KDD) processes, can also make use of databases that are denormalized.
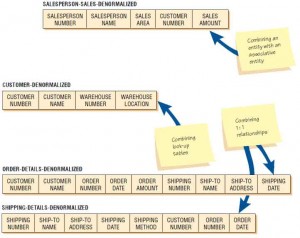
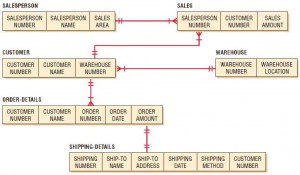
Denormalization can be accomplished in a number of different ways. Figure shown below depicts some of these approaches. First, we can take a many-to-many relationship, such as that of SALESPERSON and CUSTOMER, which share the associative entity SALES. By combining the attributes from SALESPERSON and SALES we can avoid one of the join processes. This may result in a considerable amount of data duplication, but it makes the queries about sales patterns more efficient.

Another reason for denormalization is to avoid repeated reference to a lookup table. It may be more efficient to repeat the same information—for example, the city, state, and zip code—even though this information can usually be stored as a zip code only. Hence, in the sales example, CUSTOMER and WAREHOUSE may be combined.
Finally, we look at one-to-one relationships because they are very likely to be combined for practical reasons. If we learn that many of the queries regarding orders also are interested in how the order was shipped, it would make sense to combine, or denormalize. Hence, in the example, some of the details can appear in both ORDER-DETAILS and SHIPPING-DETAILS when we go through denormalization.

